Japan 3D Imaging Market Analysis
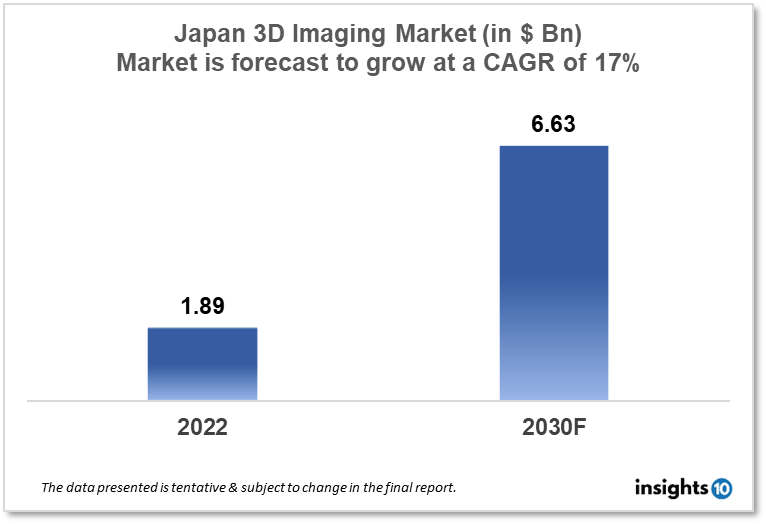
Japan's 3D Imaging market is projected to grow from $ 1.89 Bn in 2022 to $ 6.63 Bn by 2030, registering a CAGR of 17% during the forecast period of 2022-30. The market will be driven by rising demand for precise medical imaging technologies & an increase in chronic illnesses in the growing population. The market is segmented by product, application, end-user & by portability. Some major players include Toshiba Medical Systems Corporation, Hitachi Medical Corporation & Shimadzu Corporation.
Buy Now

Japan 3D Imaging Market Executive Summary
Japan's 3D imaging market is projected to grow from $ 1.89 Bn in 2022 to $ 6.63 Bn by 2030, registering a CAGR of 17% during the forecast period of 2022-30. According to the World Health Organization Global Health Expenditure database, Japan's per capita health expenditure (% - GDP) has observed a decent change from $4,256 which is 10.75% of GDP in 2018 to $4,360 which would be 10.74% of GDP in 2019. The country has an advanced and technologically advanced healthcare system, as evidenced by its high healthcare spending. In 2022, the death rate in Japan was 12.7 per 1,000 people. Cancer is responsible for 29% of deaths in Japan, with Cardiovascular diseases following, and is likely to demand the growth of the medical device market, including the 3D imaging market, in Japan.
Japan's 3D imaging market is one of the world's most established. The country has a robust healthcare system with a significant level of technological adoption and a heavy emphasis on modern medical instruments, such as 3D imaging systems. Out of all the varieties of 3D Imaging alternatives such as X-ray Imaging Systems, Computed Tomography (CT), Magnetic Resonance Imaging (MRI), Ultrasound & Nuclear Imaging systems, In Japan, computed tomography (CT) scanners are the most often used 3D imaging device. CT scans are widely utilized for a range of purposes, including the identification of illnesses and ailments in the chest, abdomen, pelvis, and head, as well as radiation therapy planning, and have become an indispensable tool in modern medical practice in Japan.
In October 2022, Saki Corporation, a leader in automated optical and X-ray diagnostic equipment, announced the introduction of a new type of in-line 3D-CT automated X-ray inspection system (AXI) for power module inspection.
Market Dynamics
Market Growth Drivers
The 3D imaging market in Japan is expanding as a result of various reasons, including rising demand for cutting-edge imaging technologies, an increase in chronic illnesses, government support and investment in medical infrastructure, and an aging population. The increased awareness of the advantages of early illness and condition diagnosis and treatment, as well as the development of new technologies and imaging methodologies, has resulted in an increase in demand for 3D imaging systems in Japan.
Japan's elderly population, which is one of the world's largest, is also adding to the need for 3D imaging equipment.
Market Restraints
The Japanese 3D imaging market is encountering certain hurdles that are limiting its growth. The significant cost of 3D imaging devices, the scarcity of experienced specialists, and the restricted reimbursement for 3D imaging operations are only a few examples. The cost of 3D imaging equipment is much greater than that of typical 2D imaging systems, making adoption challenging for many healthcare organizations. The restricted reimbursement for 3D imaging operations is another issue since many insurance companies do not reimburse the entire cost of these procedures. These constraints may deter health centers from using 3D imaging technology, limiting the growth of the Japanese 3D imaging industry.
Competitive Landscape
Key Players
- Toshiba Medical Systems Corporation
- Hitachi Medical Corporation
- Shimadzu Corporation
- Fujifilm Corporation
- Canon Medical Systems Corporation
- Hologic Inc.
- GE Healthcare
- Philips Healthcare
- SAKI CORPORATION (JPN)
Healthcare Policies and Regulatory Landscape
The Ministry of Health, Labour, and Welfare (MHLW) is in charge of regulating the 3D imaging market in Japan. The MHLW establishes rules and guidelines for medical equipment, including 3D imaging systems, to assure their safety and efficacy for patients. The government has invested in imaging technology research and development, as well as provided incentives for healthcare facilities to use 3D imaging equipment.
Reimbursement Scenario
The statutory health insurance system in Japan offers universal coverage. It is mostly supported by tax and individual contributions. It is necessary to register in either an employment-based or a residence-based health insurance plan. The national healthcare insurance system in Japan reimburses patients for 3D imaging treatments, covering a percentage of the cost. The degree of reimbursement, however, may vary based on the treatment and the type of imaging technology employed.
1. Executive Summary
1.1 Digital Health Overview
1.2 Global Scenario
1.3 Country Overview
1.4 Healthcare Scenario in Country
1.5 Digital Health Policy in Country
1.6 Recent Developments in the Country
2. Market Size and Forecasting
2.1 Market Size (With Excel and Methodology)
2.2 Market Segmentation (Check all Segments in Segmentation Section)
3. Market Dynamics
3.1 Market Drivers
3.2 Market Restraints
4. Competitive Landscape
4.1 Major Market Share
4.2 Key Company Profile (Check all Companies in the Summary Section)
4.2.1 Company
4.2.1.1 Overview
4.2.1.2 Product Applications and Services
4.2.1.3 Recent Developments
4.2.1.4 Partnerships Ecosystem
4.2.1.5 Financials (Based on Availability)
5. Reimbursement Scenario
5.1 Reimbursement Regulation
5.2 Reimbursement Process for Diagnosis
5.3 Reimbursement Process for Treatment
6. Methodology and Scope
Japan 3D Imaging Market Segmentation
By Product (Revenue, USD Billion):
The 3D Imaging Market is divided majorly into X-ray Imaging Systems, Computed Tomography (CT), Magnetic Resonance Imaging (MRI), Ultrasound & Nuclear Imaging Systems. X-ray Imaging systems have the highest market share in the 3D Imaging market. 3D X- rays are mostly utilized for dental and orthopedic applications. 3D Ultrasound is majorly helpful in tracking the dynamic motion of arteries, and veins and also has applications for various fetal, cardiac, obstetric, and rectal examinations, and many more. The ultrasound segment is predicted to develop substantially over the forecast period, primarily to the advancements in technology in the healthcare industry and the several advantages given by 3D ultrasound imaging over standard ultrasound imaging.
- X-ray Imaging Systems
- Computed Tomography (CT)
- Magnetic Resonance Imaging (MRI)
- Ultrasound
- Nuclear Imaging systems
By Application (Revenue, USD Billion):
The market for 3D Imaging has applications covering Cardiology, Neurology, Orthopaedics, Gynaecology, Oncology, and other areas of diagnostics as well. Cardiovascular diseases are the leading cause of death globally. The second biggest cause is cancers because of which Oncology holds the highest market share in the 3D Imaging market followed by cardiology as 3D imaging is highly utilized in these two segments for diagnostics and treatments of the same. Neurosurgeons desire three-dimensional (3D) imagery of intracranial tumors, neural structures, skulls, and veins to establish a clear visual image of the surgical field's anatomical orientation prior to surgical intervention aiding better surgical outcomes for patients. Obstetricians employ 3D ultrasound scans to see the gestational sac, pinpoint the location of an ectopic pregnancy, and evaluate for fetal deformities of the face, spine, limbs, and heart. 3D Imaging applications for gynecology are yet in evolving stage and have a great scope for expansion allowing feasible and quick patient care.
- Cardiology
- Neurology
- Orthopedics
- Gynecology
- Oncology
- Others (Urology, etc.)
By End User (Revenue, USD Billion):
Hospitals, Diagnostic Imaging Centers, and other end-user such as private clinics make up the segments of the 3D Imaging Market. The hospitals among these hold the biggest market share due to the increased uptake of cutting-edge medical technology, the expansion of existing 3D Imaging facilities, the rising affordability of 3D Imaging services, the rising prevalence of chronic conditions such as cardiovascular diseases, cancers, respiratory diseases which lead to rising in demand for precise and quick diagnostic and treatment options. Diagnostic Imaging Centers have also been deploying 3D Imaging equipment to improve their standard of care.
- Hospitals
- Diagnostic Imaging Centers
- Other End Users
By Portability (Revenue, USD Billion):
The 3D Imaging market is divided into two segments Stationary & Mobile, considering the portability of the device. Stationary 3D imaging involves equipment that is installed at a particular location and is operated from the same location of installment whereas mobile ones can be relatively smaller in size and hence moved to the patients who are unable to locate the Imaging room. Mobile MRI, Ultrasound, X–ray & CT allow cutting-edge healthcare to be delivered to nearly any location and are yet in the developing stages of expansion.
- Stationary
- Mobile
Methodology for Database Creation
Our database offers a comprehensive list of healthcare centers, meticulously curated to provide detailed information on a wide range of specialties and services. It includes top-tier hospitals, clinics, and diagnostic facilities across 30 countries and 24 specialties, ensuring users can find the healthcare services they need.
Additionally, we provide a comprehensive list of Key Opinion Leaders (KOLs) based on your requirements. Our curated list captures various crucial aspects of the KOLs, offering more than just general information. Whether you're looking to boost brand awareness, drive engagement, or launch a new product, our extensive list of KOLs ensures you have the right experts by your side. Covering 30 countries and 36 specialties, our database guarantees access to the best KOLs in the healthcare industry, supporting strategic decisions and enhancing your initiatives.
How Do We Get It?
Our database is created and maintained through a combination of secondary and primary research methodologies.
1. Secondary Research
With many years of experience in the healthcare field, we have our own rich proprietary data from various past projects. This historical data serves as the foundation for our database. Our continuous process of gathering data involves:
- Analyzing historical proprietary data collected from multiple projects.
- Regularly updating our existing data sets with new findings and trends.
- Ensuring data consistency and accuracy through rigorous validation processes.
With extensive experience in the field, we have developed a proprietary GenAI-based technology that is uniquely tailored to our organization. This advanced technology enables us to scan a wide array of relevant information sources across the internet. Our data-gathering process includes:
- Searching through academic conferences, published research, citations, and social media platforms
- Collecting and compiling diverse data to build a comprehensive and detailed database
- Continuously updating our database with new information to ensure its relevance and accuracy
2. Primary Research
To complement and validate our secondary data, we engage in primary research through local tie-ups and partnerships. This process involves:
- Collaborating with local healthcare providers, hospitals, and clinics to gather real-time data.
- Conducting surveys, interviews, and field studies to collect fresh data directly from the source.
- Continuously refreshing our database to ensure that the information remains current and reliable.
- Validating secondary data through cross-referencing with primary data to ensure accuracy and relevance.
Combining Secondary and Primary Research
By integrating both secondary and primary research methodologies, we ensure that our database is comprehensive, accurate, and up-to-date. The combined process involves:
- Merging historical data from secondary research with real-time data from primary research.
- Conducting thorough data validation and cleansing to remove inconsistencies and errors.
- Organizing data into a structured format that is easily accessible and usable for various applications.
- Continuously monitoring and updating the database to reflect the latest developments and trends in the healthcare field.
Through this meticulous process, we create a final database tailored to each region and domain within the healthcare industry. This approach ensures that our clients receive reliable and relevant data, empowering them to make informed decisions and drive innovation in their respective fields.
To request a free sample copy of this report, please complete the form below.
We value your inquiry and offer free customization with every report to fulfil your exact research needs.
